Behind-the-Meter Power Generation Options: What They Are and Why They Matter in 2026
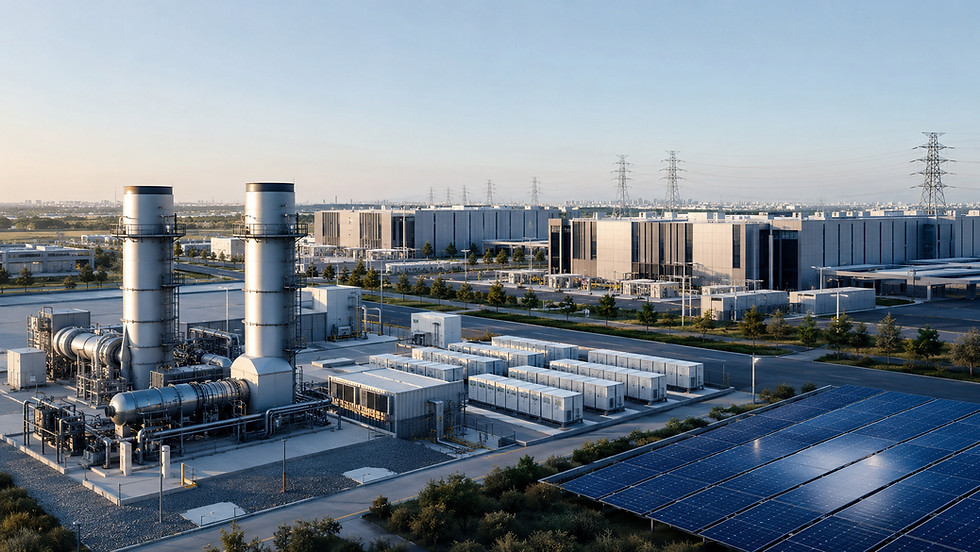
For decades, industrial facilities and data centers treated the utility grid as an unlimited resource that would be ready whenever a plant was ready to energize. In 2026, that assumption has become one of the largest schedule and cost risks on a capital project. Large-load interconnection queues have stretched from months into years, and for gigawatt-scale data centers, waiting on utility transmission upgrades can make a project commercially unviable before the first server rack is installed.
That pressure is why energy decision-makers now evaluate behind-the-meter power generation options during front-end engineering design (FEED) rather than treating on-site power as an afterthought. By generating electricity on the customer side of the utility meter, a facility controls its own schedule, hedges its energy costs, and improves load reliability without waiting on the grid.
This guide defines behind-the-meter power, distinguishes it from front-of-the-meter generation, explains the market forces driving distributed generation, and lays out the site-specific decision factors that determine which on-site power generation strategy fits a given facility.
What Is Behind-the-Meter Power?
Behind-the-meter (BTM) power is electricity generated and consumed on the customer side of the utility revenue meter, rather than drawn from the public grid. The facility produces its own power on-site to serve primary load, backup load, or both. It is a core form of distributed generation, in contrast to centralized power plants that dispatch electricity onto the transmission system.
Behind-the-meter power spans a range of technologies, from mature to emerging:
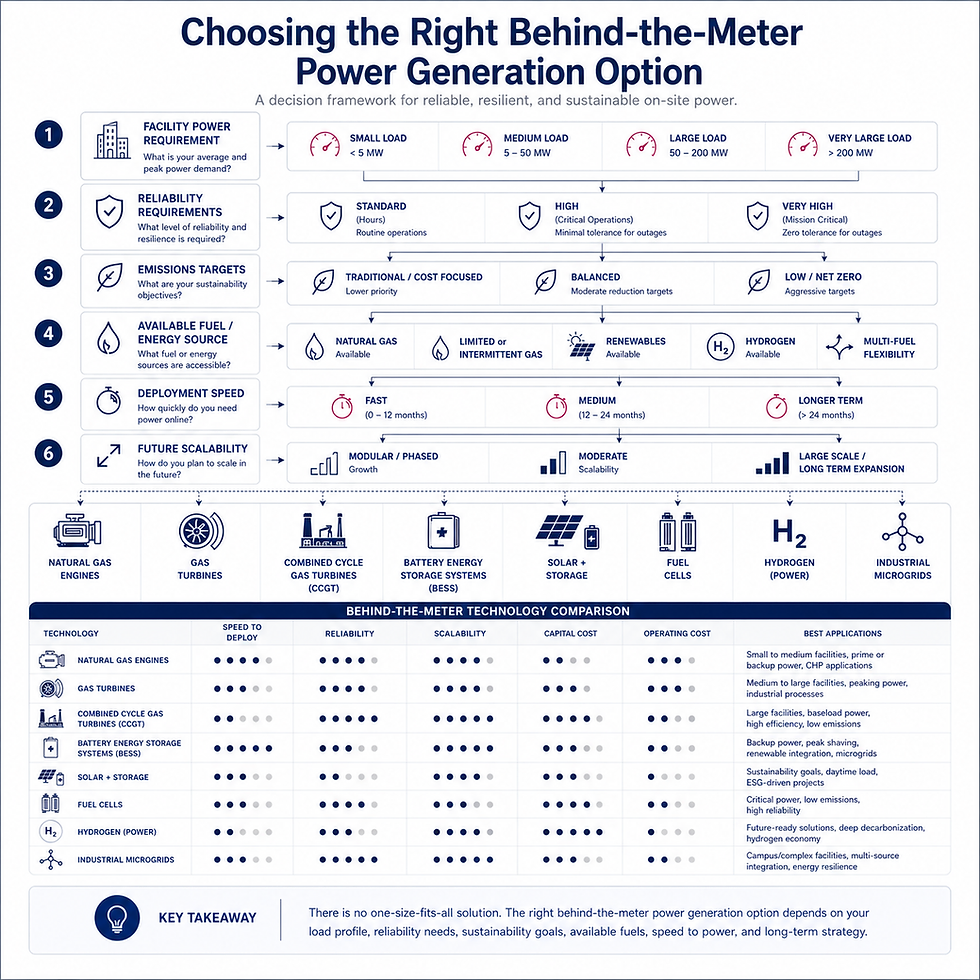
Reciprocating gas engines and gas turbines, including combined-cycle gas turbines (CCGT)
Solar photovoltaic arrays paired with battery storage (solar plus storage)
Fuel cells running on natural gas or hydrogen, including solid oxide fuel cells (SOFC)
Battery energy storage systems (BESS) for peak shaving and firming
Industrial microgrids that orchestrate several of the above as one hybrid energy system
Behind-the-Meter vs. Front-of-the-Meter

The meter is the boundary that decides who the electricity serves, how it is regulated, and how it is paid for. Front-of-the-meter (FTM) generation is utility-scale and dispatched onto the grid, sold through wholesale markets and subject to transmission interconnection. Behind-the-meter generation sits on the customer side, serving on-site load first and, in some configurations, exporting surplus. That single distinction is why behind-the-meter projects can sidestep the multi-year generation interconnection queue that constrains grid-scale power.
Common Operating Modes
Behind-the-meter assets are configured for one or more duty cycles:
Baseload / primary power: continuous generation as the main supply, matching flat industrial and data center load profiles.
Peak shaving: running generators or discharging batteries during expensive peak windows to cut demand charges.
Backup and resilience: covering critical load through grid outages, weather events, and disturbances.
Islanding: disconnecting from the grid and running self-sufficiently, then resynchronizing when the grid returns.
Grid-parallel operation: running alongside the grid for reliability, sometimes exporting excess generation.
From Emergency Backup to Primary Power
Historically, on-site power generation meant diesel gensets sitting idle until a storm knocked out the grid. Modern behind-the-meter systems are engineered for continuous duty: a high-efficiency gas plant running baseload around the clock, a microgrid islanding a site during outages, or a battery system shaving peak demand charges. The design intent has shifted from surviving an outage to supplying the load, and that reframing is what makes on-site generation a strategic, rather than emergency, investment.
Why Behind-the-Meter Power Generation Options Matter Now
The move to on-site power is not only a sustainability play. It is a shift in how capital projects are executed, driven by three converging forces.
1. Grid Interconnection Delays and Speed to Power
The single biggest threat to a new large-load project is time to power. Large-load interconnection studies and the transmission upgrades they trigger now run multiple years, and in the most constrained regions the wait can exceed five years. For a developer that needs to energize within 18 to 24 months, that timeline is disqualifying. Bank of America analysts project that data center demand will outpace planned utility capacity additions by more than 100 GW through 2030, widening the supply gap that pushes developers toward self-generation.
2. AI-Driven Load Growth
Generative AI has reshaped facility load profiles. AI-optimized server racks draw far more power and run at higher utilization than conventional IT. The IEA projects global data center electricity demand will roughly double to about 945 TWh by 2030, with electricity demand from AI-optimized data centers projected to more than quadruple over the same period. Gartner projects that AI-optimized servers will account for 64% of the incremental power demand from data centers by 2030. Grid buildout cannot match that pace, which forces developers to build dedicated generation alongside the compute.
3. Regulation and Cost Control
In June 2026, FERC issued Section 206 show cause orders directing all six RTOs and ISOs to justify or reform how they interconnect large loads such as data centers. The action followed the Department of Energy's October 2025 advance notice of proposed rulemaking, which targeted loads of 20 MW and above, and it aims to accelerate large-load interconnection while protecting other ratepayers from cost shifts. At the same time, grid-connected industrial users remain exposed to volatile wholesale and retail rates. A behind-the-meter strategy lets a facility lock in energy economics through long-term fuel supply or owned renewable generation, insulating operating cost from utility rate moves.
The Houston and Gulf Coast Angle
Nowhere is this playing out faster than the Texas Gulf Coast. Texas leads the country in planned behind-the-meter natural gas capacity, with roughly 40 GW earmarked to power data centers according to Bloomberg and Global Energy Monitor data. Houston's dense petrochemical and industrial base, its proximity to low-cost Permian and Haynesville gas, and sustained load growth on the ERCOT grid make on-site power generation especially attractive for new industrial and digital infrastructure in the region. For operators weighing the Houston Texas energy market, behind-the-meter generation converts grid uncertainty into a controllable, engineered input.
Site-Specific Decision Factors
The right behind-the-meter strategy is set by the site, not by a favored technology. A rigorous technology screening weighs the load profile and capacity factor, the quantity of power needed today versus planned growth, fuel access (firm gas pipeline capacity or hydrogen supply), land availability, emissions targets and permitting exposure, the balance between capital and operating cost, the required speed to power, and the facility's reliability target. Part 2 of this series turns each of these into a side-by-side comparison of the leading technologies.
Conclusion: De-Risking the Capital Project
The era of assuming the grid will be ready when construction finishes is over. Evaluating behind-the-meter power generation options is now a mandatory step in confirming the commercial viability of any high-load facility, whether a gigawatt-scale data center or a petrochemical expansion. The projects that treat power supply as an engineered part of the scope, not a utility formality, are the ones that come online on schedule and hold their operating economics steady.
RVN Inc.'s engineering team runs technology screening and feasibility studies for on-site power. Contact us to evaluate the right behind-the-meter strategy for your site.
Frequently Asked Questions
What does behind-the-meter mean in power generation?
It refers to electricity produced and consumed on-site, on the customer side of the utility revenue meter, rather than drawn from the central public grid.
What is the difference between behind-the-meter and front-of-the-meter power?
Front-of-the-meter generation is utility-scale and dispatched onto the grid through wholesale markets. Behind-the-meter generation sits on the customer side and serves on-site load first, which is why it can bypass the generation interconnection queue.
Why are data centers turning to on-site power generation?
Large-load interconnection can take years. Generating power on-site lets developers bypass those delays and energize faster to meet AI-driven demand growth.
Are behind-the-meter systems connected to the grid at all?
Often, yes. Many run in hybrid mode, using the grid for backup or exporting surplus power, though fully off-grid configurations are becoming more common for large data centers.
What is the most common behind-the-meter power source today?
Natural gas generation, using reciprocating engines or turbines, currently dominates heavy industrial and data center applications because of its fast deployment and firm baseload profile.
How do microgrids fit into behind-the-meter power?
A microgrid is an advanced behind-the-meter setup that networks multiple sources under smart controls, so the facility keeps running if the main grid fails.
Do on-site power plants require environmental permitting?
Yes. Combustion options such as natural gas generators require air quality permits (for example NOx and CO2), which must be built into the project schedule.
Sources:
Bank of America, via Utility Dive (2026). Analysis of U.S. data center electricity demand and projected utility capacity gap through 2030.
Lawrence Berkeley National Laboratory (Berkeley Lab). Interconnection Queue Studies documenting multi-year grid interconnection delays across U.S. regions.
International Energy Agency. Energy and AI (2025). Forecasts for global data center electricity demand and AI-driven power consumption.
Gartner. Press Release (November 2025). AI-optimized server contribution to future data center power demand.
Federal Energy Regulatory Commission (FERC). Section 206 Show Cause Orders (June 18, 2026) regarding large-load interconnection reforms.
United States Department of Energy. Advance Notice of Proposed Rulemaking (ANOPR), October 23, 2025, addressing interconnection of large electricity loads.
White & Case. Legal analysis of FERC's June 2026 large-load interconnection orders.
McGuireWoods. Commentary on FERC Section 206 proceedings and implications for large-load customers.
RBC Capital Markets and Bloomberg. Analysis of planned behind-the-meter natural gas generation capacity for data centers in Texas (2026).
Global Energy Monitor (2026). Dataset and tracking of planned behind-the-meter power projects in Texas and the United States.


Comments